Latest Market Rental Utilization Data – December 2024
This comprehensive data prepared by Rouse Services offers valuable insights into the current trends and performance of rental equipment. Explore detailed information about equipment utilization rates and demand fluctuations, allowing for better planning and operational efficiency.
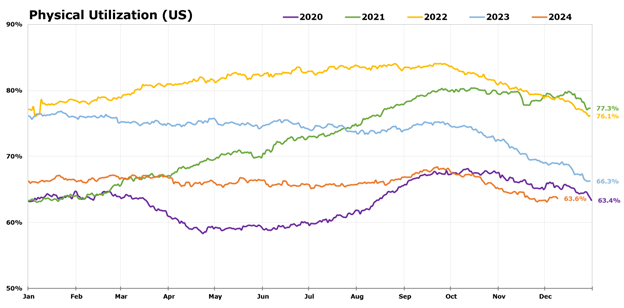
Physical Utilization (US)
Physical utilization in 2024 has reached its lowest levels since 2020, highlighting ongoing challenges in balancing rental supply and demand. After peaking at 68.1% in late September, utilization steadily declined to 63.6% by early December, falling below 2020 levels in early October.
While rental fleet size (supply) has continued to grow steadily year-over-year (YoY), units on rent (demand) have seen a slight YoY decline. This growing supply-demand imbalance has placed sustained downward pressure on utilization rates throughout the year. The flat utilization trend in 2024, combined with the late November low of 63.1%, reflects a consistent underperformance relative to prior years.

Note: Limited to independents and dealers in the USA. Physical Utilization is computed from daily fleet snapshots from Rouse participants, calculated as “Average Daily Cost on Rent” divided by “Average Daily Cost in Fleet.”
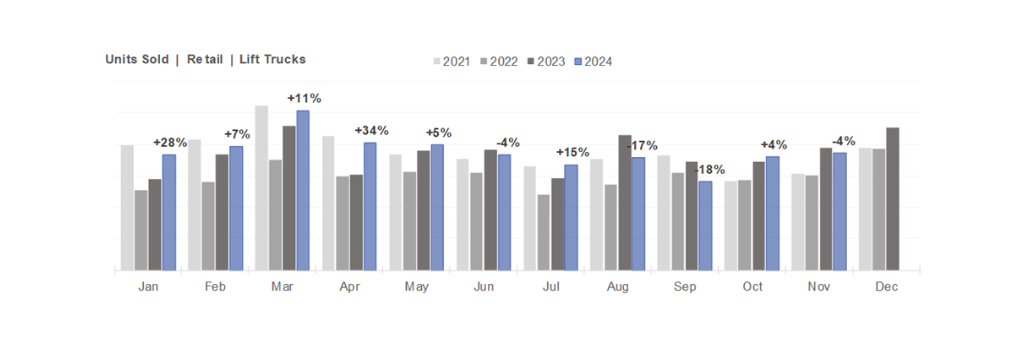
Units Sold | Retail | Lift Trucks
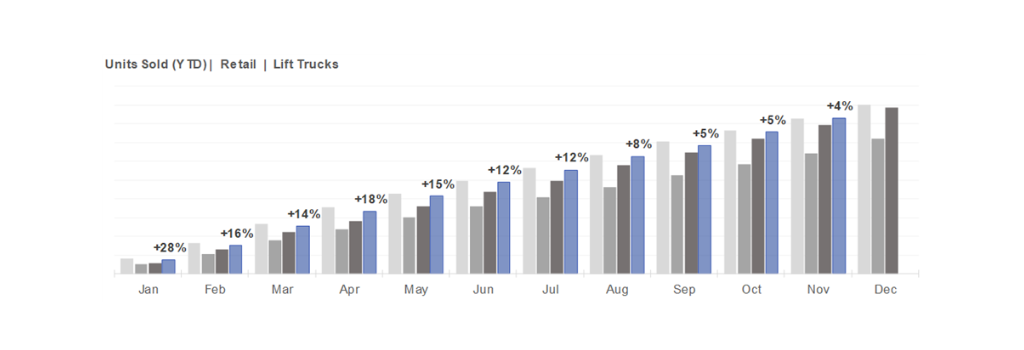
In 2024, the retail lift truck market has experienced steady YoY growth, with a year-to-date (YTD) increase of 4%. Early-year momentum, fueled by strong sales in January (+28%), February (+47%), and April (+34%), drove much of this growth. However, sales moderated in the latter half of the year, with declines in August (-17%), September (-18%), and November (-4%).
Despite these late-year fluctuations, robust early-year sales volumes have kept the market on track for modest annual growth, underscoring resilience in demand even amid month-to-month variability.

Note: Limited to independents and dealers in the USA. Used Equipment.

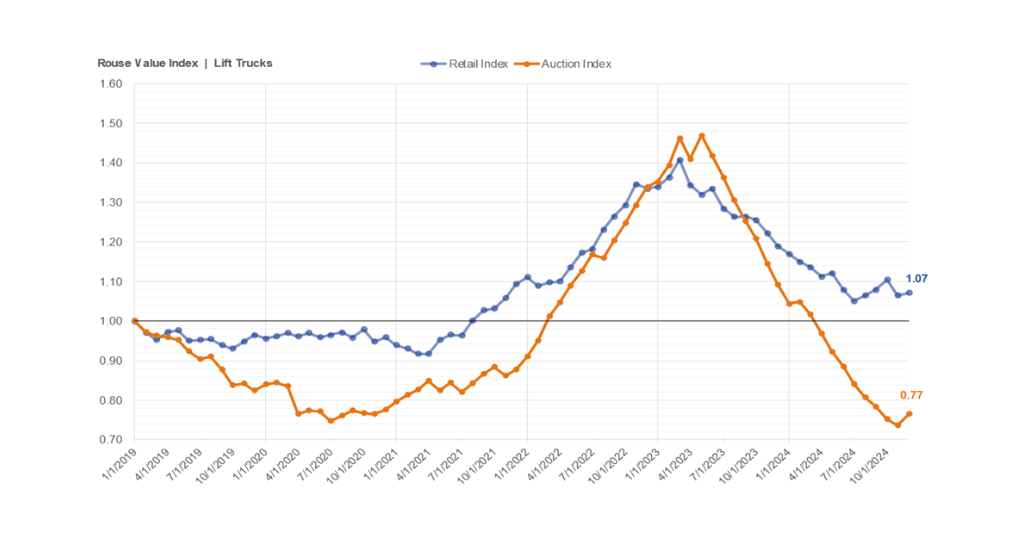
Rouse Value Index | Lift Trucks
In 2024, both Auction and Retail values for lift trucks have declined, but recent months show signs of stabilization. As of November, Auction values fell to 77% of their January 2019 levels, reflecting a notable decrease. However, a slight month-over-month (MoM) increase in Auction values suggests that the decline may be slowing, indicating a potential bottoming out.
Retail values, on the other hand, have shown more stability. After some declines earlier in the year, they are currently roughly 7% above their January 2019 levels. Notably, mid-year trends—particularly in July and August 2024—show signs of stabilization, with a slight uptick in retail values.

Note: Focus on Used Equipment (three to eight years old). Retail and Auction Values Indexed to January 2019, USA only.


