Latest Market Rental Utilization Data – 1st Qtr. 2025
This comprehensive data prepared by Rouse Services offers valuable insights into the current trends and performance of rental equipment. Explore detailed information about equipment utilization rates and demand fluctuations, allowing for better planning and operational efficiency.
Physical utilization in 2025 started at the lowest level recorded since 2019, remaining relatively flat in the low 60% range throughout Q1. This trend is primarily driven by an increase in year-over-year fleet supply, which began rising in late 2022, peaked in 2023, and has remained elevated. Additionally, rental demand has softened slightly since late 2023, following the surge experienced during the COVID-19 period.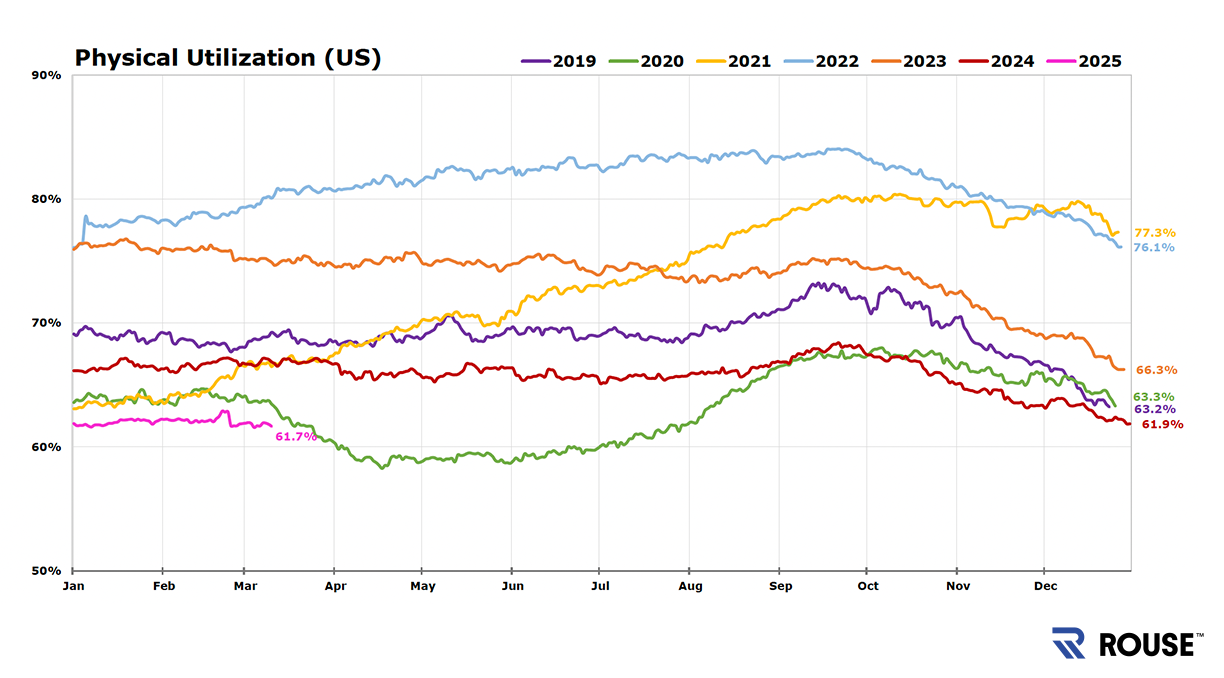
Note: Limited to independents and dealers in the USA. Physical Utilization is computed from daily fleet snapshots from Rouse participants, calculated as “Average Daily Cost on Rent” divided by “Average Daily Cost in Fleet.”